Settings
Opening Settings
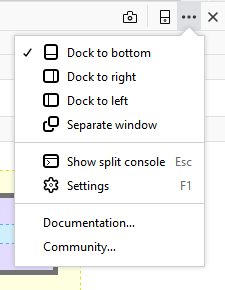
The Developer Tools settings can be opened by clicking the … (ellipsis) icon on the right of the tab.

The menu includes settings to control the location of the Developer Tools. You can choose between the default setting at the bottom of the windows, or move the tools to the left or right side of the screen. These settings are particularly useful if you have a widescreen monitor. You can also choose to open the tools in a separate window.
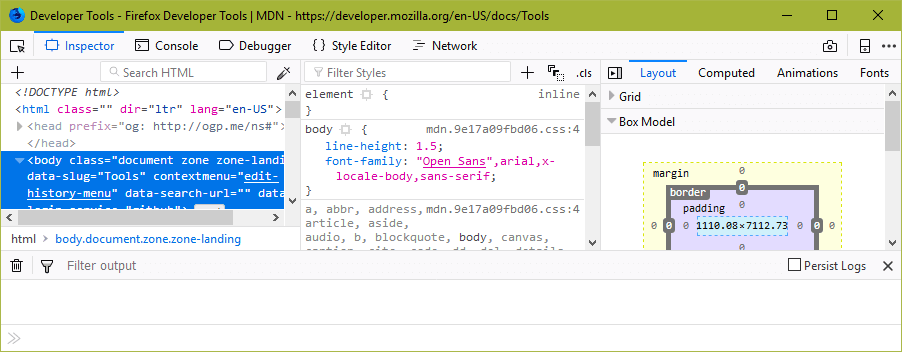
Show split console adds a section at the bottom of the tools showing the console. It makes visible the command line and one or two lines of the console output.

The rest of the settings are on the Developer Tools Settings Pane. To see the settings, open any of the Developer Tools, and then:
click the “Settings” command in the menu:

or press F1 to toggle between the active tool and the Settings pane
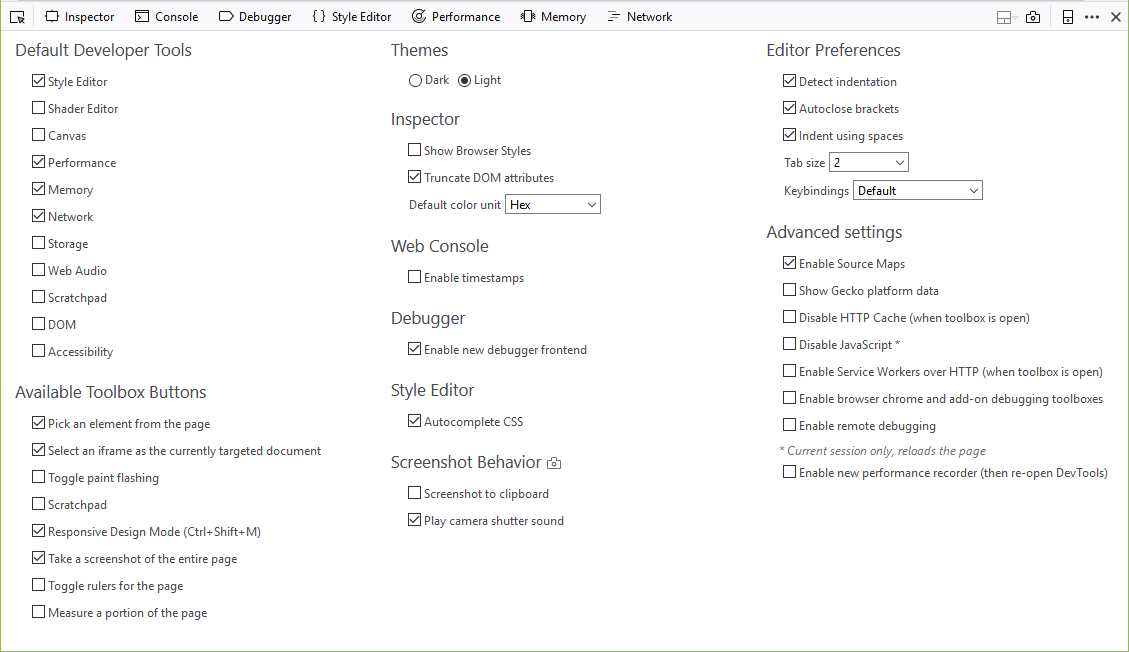
The Settings pane looks something like this:

Categories
Default Firefox Developer Tools
This group of checkboxes determines which tools are enabled in the toolbox. New tools are often included in Firefox but not enabled by default.
Themes
This enables you to choose one of two themes.
There’s a light theme, which is the default:

A dark theme (the default on Firefox Developer Edition):

Common preferences
Settings that apply to more than one tool. There’s just one of these:
- Enable persistent logs
A setting to control whether or not the Web Console and Network Monitor clear their output when you navigate to a new page.
Note
If Common Preferences is not included in the Settings, Web Console logs can be persisted by using the ‘about:config’ url in browser address bar, searching for: ‘devtools.webconsole.persistlog’ then toggling this value to true
Inspector
- Show browser styles
A setting to control whether styles applied by the browser (user-agent styles) should be displayed in the Inspector’s Rules view. Note that this setting is independent of the “Browser styles” checkbox in the Inspector’s Computed view.
- Truncate DOM attributes
By default, the Inspector truncates DOM attributes that are more than 120 characters long. Uncheck this box to prevent this behavior. This setting works by toggling the about:config preference
devtools.markup.collapseAttributes. To change the threshold at which attributes are truncated, you can edit the about:config preferencedevtools.markup.collapseAttributeLength.- Default color unit
A setting to control how colors are represented in the inspector:
Hex
HSL(A)
RGB(A)
HWB
color name
As authored.
- Enable layout panel
Enable the experimental layout panel. This setting only exists in Firefox Nightly.
Web Console
- Enable split console
Enables or disables the split console feature, disabling it will remove it from the Toolbar menu and disable its hotkey Esc
- Enable timestamps
Controls whether the Web Console displays timestamps. The Web Console defaults to hiding timestamps.
- Enable new console frontend
Switch to the experimental new console. This setting only exists in Firefox Nightly.
Debugger
- Enable Source Maps
Enable source map support in the debugger.
- Enable new debugger frontend
Enable the new debugger. This setting only exists in Firefox Nightly.
Style Editor
- Show original sources
When a CSS preprocessor supporting source maps is used, this enables the Style Editor to display the original, preprocessor, sources rather than the generated CSS. Learn more about Style Editor support for CSS source maps. With this setting checked, the Page Inspector Rules view will also provide links to the original sources.
- Autocomplete CSS
Enable the Style Editor to offer autocomplete suggestions.
Screenshot Behavior
- Screenshot to clipboard
When you click the icon for the Screenshot tool, copy the screenshot image to the clipboard (the image will still be saved to your Downloads directory).
- Play camera shutter sound
When you click the icon for the Screenshot tool, play a shutter sound.
Editor Preferences
Preferences for the CodeMirror source editor, which is included in Firefox and used by several developer tools, including the Style Editor.
- Detect indentation
Auto-indent new lines based on the current indentation.
- Autoclose brackets
Determines whether typing an opening character like
[or{will cause the editor to insert the matching closing character]or}for you.- Indent using spaces
When checked, indentation will be performed using spaces, when off, the editor will use tabs instead.
- Tab size
The frequency of tab stops in the editor. Select 2, 4, or 8.
- Keybindings
Choose the default CodeMirror keybindings or keybindings from one of several popular editors:
Vim
Emacs
Sublime Text
Advanced settings
- Show Gecko platform data
A setting to control whether or not profiles should include Gecko platform symbols.
- Disable HTTP Cache
Disable the browser HTTP cache to simulate first-load performance in all tabs that have the Toolbox open. This setting persists, meaning that if it is set, caching will be disabled whenever you reopen the devtools. Caching is re-enabled when the devtools are closed. Note that service workers are not affected by this option.
Note
Note that this option was called “Disable Cache” in Firefox versions previous to 49, but it was renamed to make it clearer that this affects the HTTP cache, and not Service Workers/the Cache API.</div>
- Disable JavaScript
Reload the current tab with JavaScript disabled.
- Enable Service Workers over HTTP
Enable Service Worker registrations from insecure websites.
- Enable browser chrome and add-on debugging toolboxes
Enable you to use developer tools in the context of the browser itself, and not only web content.
- Enable remote debugging
Enable the developer tools debug remote Firefox instances.
- Enable custom formatters
Allow websites to define custom formatters for JavaScript objects.